Please follow us on X and Telegram.
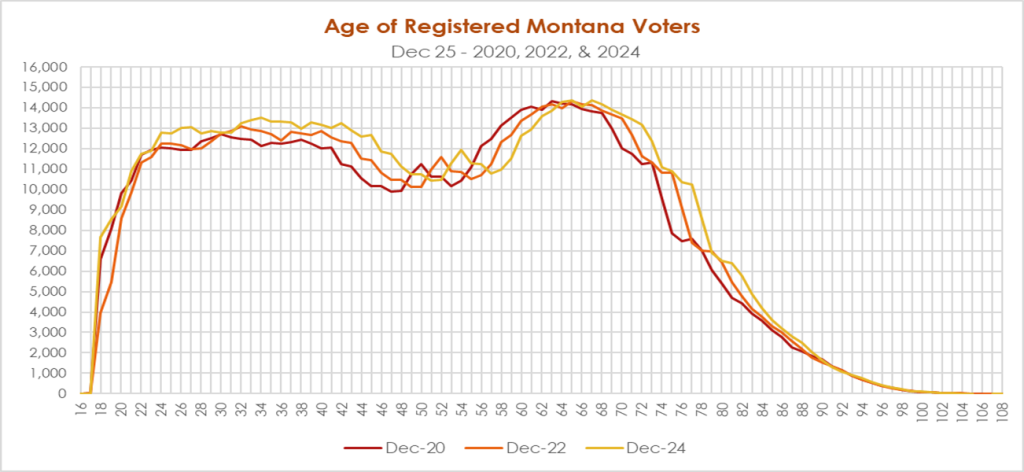
As we enter the new year of 2025, it is interesting to look back on the shifting demographics of Montana voters. The following chart clearly shows that the baby boomers are falling into the abyss as they pass away, and they are gradually representing an ever-decreasing segment of Montana’s voting population.
Over these 4 years, the number of Montana’s registered voters has grown from 752,081 to 801,386, an average growth of 1.7% per year.

If you’re wondering about those strange peaks at ages 50, 73, and 77 in the 2020 data, they reflect the spikes in the national birth rates in 1970, 1947, and 1944, as seen in the next chart.

The top of the baby boomer peak has remained relatively constant over these 4 years, so the number of people moving to Montana in this age group has roughly matched the deaths in this age group. The growth in registered voters has been in the 24-55 age group, as shown in the first chart.
The chart also indicates that the number of homes owned by the elderly that become available upon their death should roughly match the need for new homes as young voters become home owners. However, in 8-10 years that will no longer be true. Assuming Montana’s current growth rate continues, the need for new housing will increase substantially.
So why are housing prices in Bozeman going so crazy? The answer is that the demographics in Gallatin County are very different from those of Montana statewide. On average, Gallatin County has a much younger population. The baby boomers barely register a peak. Gallatin is also growing faster. Over these 4 years, the registered voter population in Gallatin has grown at a rate of 2.5%, 46% higher than Montana’s statewide. Sorry, Bozeman. It doesn’t appear that your housing crisis is going to get any better in the new year!
